Trading has changed significantly with the initiation of computers. In the coming future, blockchain technology will not only exclude intermediates but also make the stock exchange decentralized, without a need for the central system to bring supply and demand together. Since blockchain is shared by all the associates, it is easy to prevent double-spending and verify who owns tokens at some particular point in time. They can be implemented in this sector by using digital currency like bitcoins that can be stored and carried in the form of cryptographic tokens. For instance, since bitcoins uses a peer-to-peer network to broadcast information about any transactions taking place, they can be added to blocks that are cryptographically secured, forming an immutable blockchain. Also, they can be tracked and ‘colored’ to distinguish and can be associated with the ownership of certain assets like stocks, bonds etc. In this way, many different assets can be transferred using the bitcoin blockchain, but there are also other cryptocurrency networks that are authorized for exchanging multiple assets, such as Ripple.
Data-Driven? Think again
When the analysis is complex or the data are hard to process, a pinch of tragedy finds its way into our comedy. Sometimes boiling everything down to arrive at that 4.2 number takes months of toil by a horde of data scientists and engineers. At the end of a grueling journey, the data science team triumphantly presents the result: it’s 4.2 out of 5! The math was done meticulously. The team worked nights and weekends to get it in on time. What do the stakeholders do with it? Yup, same as our previous 4.2: look at it through their confirmation bias goggles, with no effect on real-world actions. It doesn’t even matter that it’s accurate—nothing would be different if all those poor data scientists just made some numbers up. Using data like that to feel better about actions we’re going to take anyway is an expensive (and wasteful) hobby. Data scientist friends, if your organization suffers from this kind of decision-maker, then I suggest sticking to the most lightweight and simple analyses to save time and money. Until the decision-makers are better trained, your showy mathematical jiu jitsu is producing nothing but dissipated heat.
How Big Data Can Play An Essential Role In Fintech Evolution

In the banking and fintech industry, like in many others, offering personalised services is one of the greatest marketing tools available. Fintech companies like Contis Group claim that more and more customers they have search for personalized and flexible fintech services and packages. The pressure to create personalized services in the industry is also driven by the increasing number of companies that adopt such strategies, thus where a keen competition is present. Alternative banking institutions began to use the services of fintech companies to improve their services and offer more personalized packages, but also a better, more comprehensive, faster infrastructure, which contributes to creating a more personalized and facile experience for the final consumer. Not only can fintech companies identify spending patterns to make banking recommendations, but they can also use those to help the final user save more money if this is one of their goals.
DevOps for Data Scientists: Taming the Unicorn

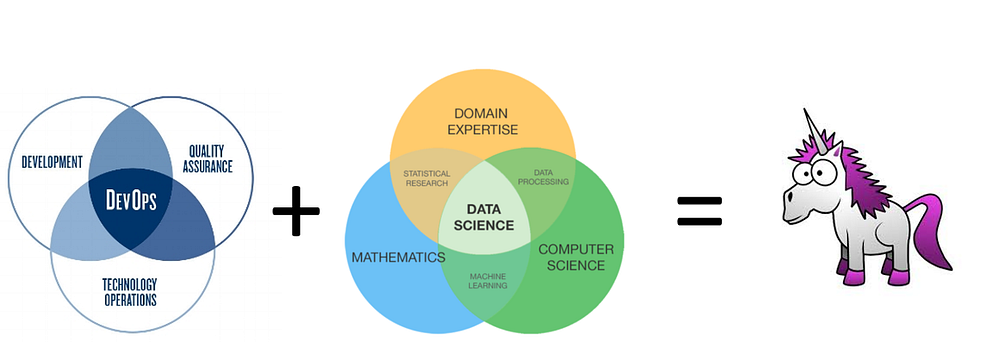
Developers have their own chain of command (i.e. project managers) who want to get features out for their products as soon as possible. For data scientists, this would mean changing model structure and variables. They couldn’t care less what happens to the machinery. Smoke coming out of a data center? As long as they get their data to finish the end product, they couldn’t care less. On the other end of the spectrum is IT. Their job is to ensure that all the servers, networks and pretty firewall rules are maintained. Cybersecurity is also a huge concern for them. They couldn’t care less about the company’s clients, as long as the machines are working perfectly. DevOps is the middleman between developers and IT. ... Imagine pushing your code to production. And it works! Perfect. No complaints. Time goes on and you keep adding new features and keep developing it. However, one of these features introduce a bug to your code that badly messes up your production application. You were hoping one of your many unit tests may have caught it.
The Democratization of Data Science
Once an organization is delivering the access and education needed to democratize data among its employees, it may be time to adjust roles and responsibilities. At a minimum, teams should be able to access and understand the data sets most relevant to their own functions. But by equipping more team members with basic coding skills, organizations can also expect non–data science teams to apply this knowledge to departmental problem solving — leading to greatly improved outcomes. If your workforce is data-literate, for example, your centralized data team can shift its focus from “doing everyone else’s data work” to “building the tools that enable everyone to do their data work faster.” Our own data team doesn’t run analyses every day. Instead, it builds new tools that everyone can use so that 50 projects can move forward as quickly as one project moved before.
Success With AI in Banking Hinges on the Human Factor
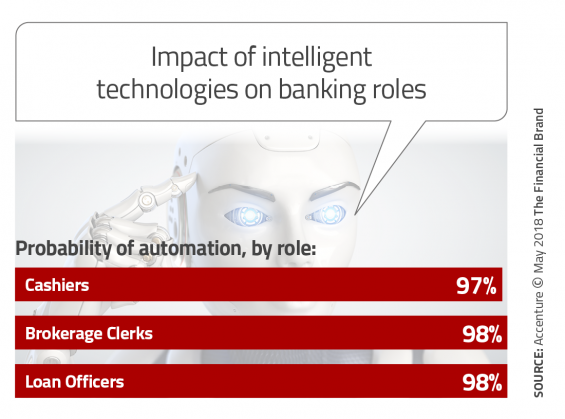
The one reason why banking operations aren’t relying on AI isn’t because of the unwillingness to adapt to change. Rather, the industry lacks the right talent to drive that change. There is a significant disconnect between the recognition of a need and an appropriate response. The Accenture research found that while executives believe that most of their employees are not ready to work with AI, only 3% of executives are planning to increase investments in retraining workers in the next three years. This is unfortunate since employees indicate that they are not only impatient to thrive in an intelligent enterprise that can disrupt markets and improve their working experience; they are also eager to acquire the new skills required to make this happen. “Banks’ lack of commitment to upskilling and reskilling employees to learn how to collaborate with intelligent technologies will significantly hinder their ability to deploy and benefit from them,” McIntyre explained.
The Connected Vehicle Environment is expected to deliver situational awareness for traffic management and operations based on data from connected vehicle equipment installed in vehicles and on a select group of roadways and intersections where the technology can reduce the number of accidents and support truck platooning, which involves electronically linking groups of trucks to drive close to one another and accelerate or brake simultaneously. The city will install 113 roadside units that will contain some or all of the following: a traffic signal controller, a Global Navigation Satellite System (GNSS) receiver to pinpoint locations, a wireless dedicated short-range communications (DSRC) radio and a message processing unit. Meanwhile, 1,800 onboard units will be installed in city fleet vehicles and volunteer citizen vehicles that will communicate with the roadside units and one another. The units will contain a GNSS receiver, a vehicle data bus, a DSRC radio, a processing unit, a power management system, software applications and a display.
IoT and data governance – is more necessarily better?

Organizations have realized that data is a strategic asset and a lot of them are trying to commoditize it. In the case of IoT, not all data is created equal. Simply hoarding data because it may be useful one day may create a much higher risk than making decisions about data that make sense for a specific organization. In the case of IoT, this has become a huge challenge because smart devices can gather unimaginable amounts of data. However, the fact that they can doesn’t mean that they should. I will not get into the details of risks around cybersecurity because that has been debated ad nauseam. I am interested in discussing the other side of the coin: business opportunities. What does having a clear strategy for the collection and use of data gathered from IoT devices mean in terms of revenue and profitability? How can data governance help achieve that goal? Data governance is the framework under which data is managed within an organization to ensure the appropriate collection (the “what to use”), processing (the “how to use”), retention (the “until when to use”) and relevance (the “why to use”) of data.
Raspberry Pi gets supercharged for AI by Google's Edge TPU Accelerator

Machine-learning models will still need to be trained using powerful machines or cloud-based infrastructure, but the Edge will accelerate the rate at which these trained models can run and be used to infer information from data, for example, to spot a specific make of car in a video or to perform speech recognition. While AI-related tasks like image recognition used to be run in the cloud, Google is pushing for machine-learning models to also be run locally on low-power devices such as the Pi. In recent years Google has released both vision and voice-recognition kits for single-board computers under its AIY Projects program. Trained machine-learning models available to run on these kits include face/dog/cat/human detectors and a general-purpose image classifier. Google is also releasing a standalone board that includes the Edge TPU co-processor and that bears a close resemblance to the Raspberry Pi. The credit-card sized Edge TPU Dev Board is actually smaller than Pi, measuring 40x48mm, but like the Pi packs a 40-pin expansion header that can be used to wire it up to homemade electronics.
Data Analytics or Data Visualizations? Why You Need Both

Depending upon the level of detail that stakeholders need to draw actionable conclusions, as well as the need to interact with or drill-down into the data, traditional data analytics might not be sufficient for businesses to excel in today’s competitive marketplace. Additional tools are needed to help extract more timely, more nuanced, and more interactive insights than data analysis alone can provide. Those tools are data visualization tools. The reason data analytics is limited might be simple enough. Data analytics helps businesses understand the data they have collected. More precisely, it helps them become cognizant of the performance metrics within the collected data that are most impactful to the business. And it can provide a clearer picture of the business conditions that are of greatest concern to decision-makers. But analytics does not do what data visualization can do: help to communicate and explain that picture with precision and brevity while in a format that the brain consumes exceedingly quickly. The data itself isn’t changed by data viz; further analysis isn’t done. But two-dimensional tables of data are not very amenable to learning; the mind tends to gloss over a large amount of it, scan for highest and lowest values, and miss the details in between.
Quote for the day:
"Tomorrow's leaders will not lead dictating from the front, nor pushing from the back. They will lead from the centre - from the heart" -- Rasheed Ogunlaru


No comments:
Post a Comment