Japan Is Using Robots As A Service To Fight Coronavirus And For Better Quality Of Life

Connected Robotics has developed a number of other food-related robots,
including a machine that produces soft-serve ice cream, another that prepares
deep-fried foods often sold at Japanese convenience stores, and yet another
that cooks bacon and eggs for breakfast. Along the way, it was selected for
the Japanese government’s J-Startup program, which highlights promising
startups in Japan, and has raised over 950 million yen ($9.1 million) from
investors including Global Brain, Sony Innovation Fund and 500 Startups
Japan. Connected Robotics wants robots to do more than just prepare food
in the kitchen. It is collaborating with the state-backed New Energy and
Industrial Technology Development Organization (NEDO) to tackle the task of
loading and unloading dishwashers. Under the project, one robot arm will
prewash dishes and load them into a dishwashing machine, and another arm will
store the clean dishes. The company aims to roll out the machine next spring,
part of its goal to have 100 robot systems installed in Japan over the next
two years. From that point, it wants to branch out overseas into regions such
as Southeast Asia.
DevOps Chat: Adopting Agile + DevOps in Large Orgs

The first step towards creating a change is to acknowledge that you need to
change, because once everyone acknowledges that you need to change you can
start to think about, well, what sort of change do we want to have? And this
has to be a highly collaborative effort. It’s not just your CXOs locking
themselves in a conference room at a resort for two days and whiteboarding
this out. This has to be a truly collaborative exercise across the entire
organization. There may need to be some constraints that are in place, and
what I’ve typically seen is a board of directors might say, “Look, this is
where we want to be five years from now,” not necessarily saying how that
needs to be achieved but saying this is where we want to be. That in
combination with creating that sense of urgency says, “Look, if we need to hit
this sort of a target we need to be able to develop software faster or close
out outages quicker or have a more Agile procurement process or whatever else
it might be,” and that’s when you start to identify these sort of strategic
and tactical initiatives. Because you’re working collaboratively you’re
dispersing that cognitive effort, if you will. So it’s not just somebody from
one particular vantage point saying, “As a CFO I think we are giving away too
much money so we’re going to be cost-cutting only.”
How empathy drives IT innovation at Thermo Fisher Scientific
The development of an instrument here has always involved an incredible amount
of scientific innovation and industrial design. Over the last few years, we
have had the added complexity of building software and IoT sensors right into
the products. We also develop software that enables our customers’ lab
operations. My digital engineering organization has agile capabilities that we
can carry over to the development we are doing on customer software solutions.
The product groups make the decisions about what solution to develop, but our
agile teams, who have been developing software for years, now help the product
teams with delivery. ... Now that cloud services are mature, we are all in. We
are also very excited about artificial intelligence and its transformational
potential, particularly in life sciences. We are putting AI into our customer
service operations so that agents spend more time helping a customer and
aren’t worrying about how quickly they can finish their service call. AI
is also becoming very important for gene sequencing and diagnostics in drug
manufacturing. We are only scratching the surface there, but by creating
hybrid AI teams made up of both IT and product people, we avoid reinventing
the wheel.
CAP Theorem, PACELC, and Microservices
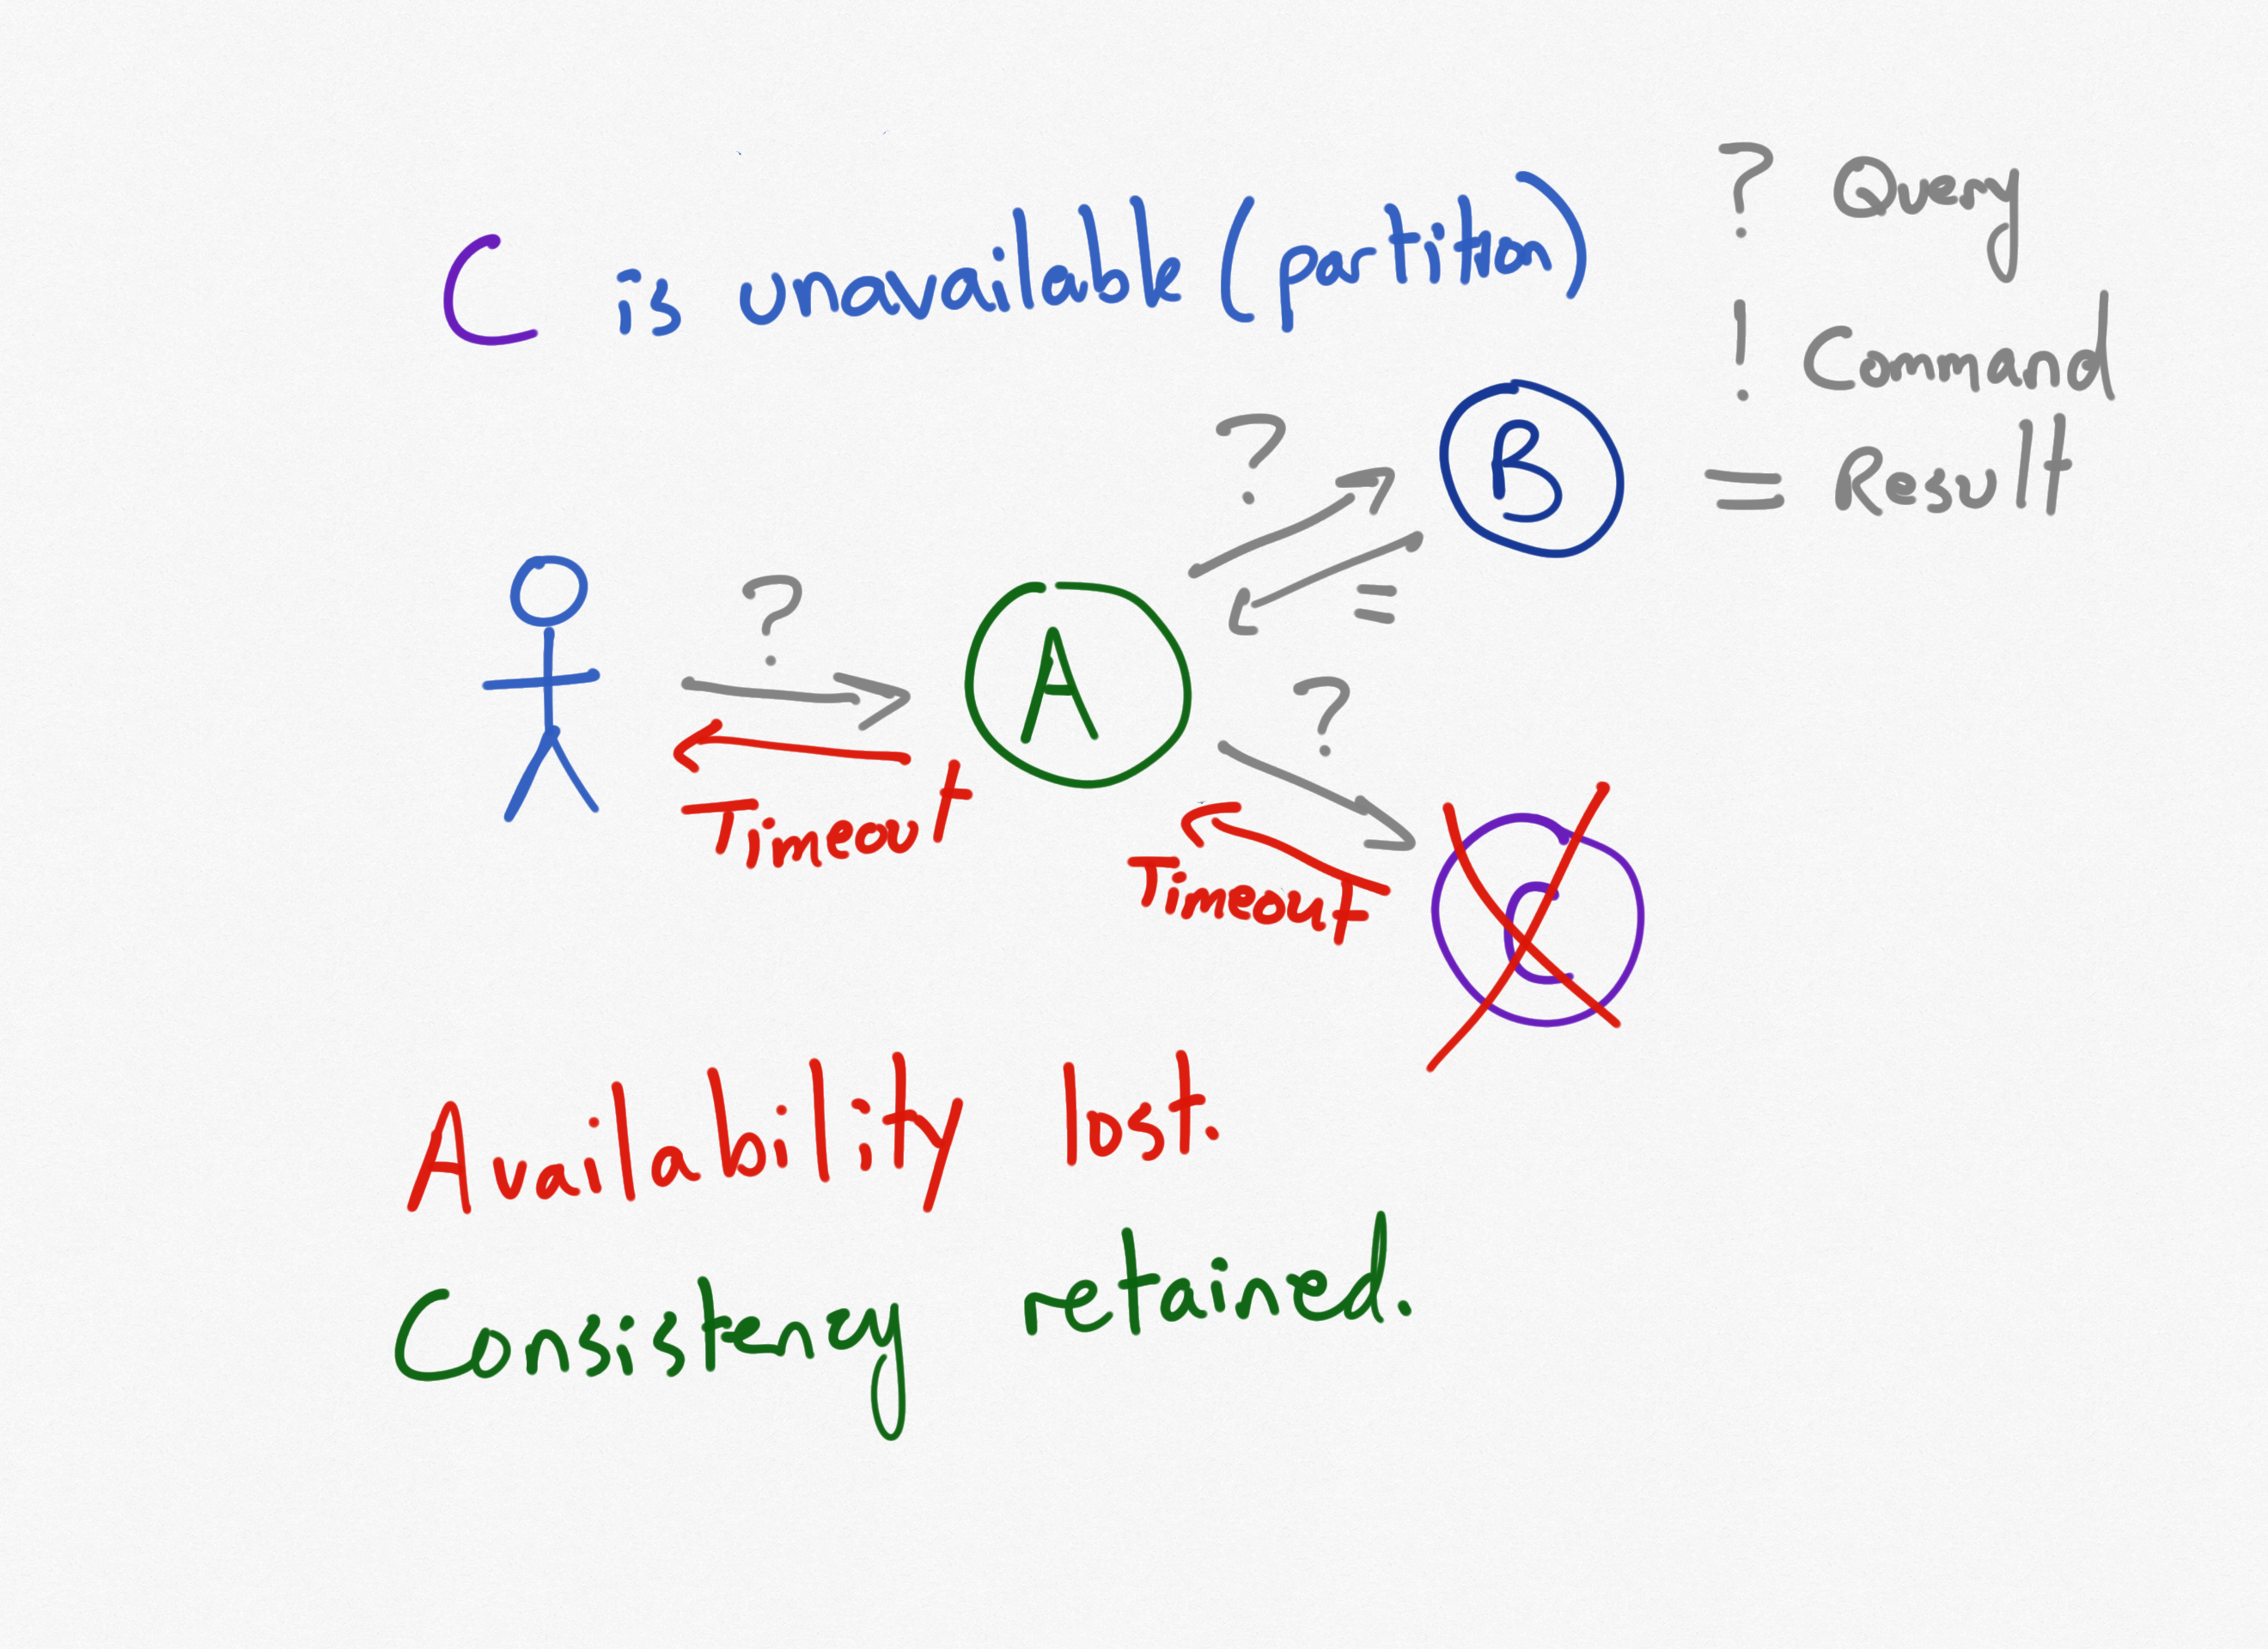
These architectural decisions have impacts that extend beyond data centers and
cloud providers. They impact how users interact with the system and what their
expectations are. It's important in a system that is eventually consistent
that users understand that when they issue a command and get a response, that
doesn't necessarily mean their command completed, but rather that their
command was received and is being processed. User interfaces should be
constructed to set user expectations accordingly. For example, when you place
an order from Amazon, you don't immediately get a response in your browser
indicating the status of your order. The server doesn't process your order,
charge your card, or check inventory. It simply returns letting you know
you've successfully checked out. Meanwhile, a workflow has been kicked off in
the form of a command that has been queued up. Other processes interact with
the newly placed order, performing the necessary steps. At some point the
order actually is processed, and yet another service sends an email confirming
your order. This is the out-of-band response the server sends you, not through
your browser, synchronously, but via email, eventually. And if there is a
problem with your order, the service that checked out your cart on the web
site doesn't deal with it.
How to Evolve and Scale Your DevOps Programs and Optimize Success
First, there is the fact that simple DevOps managerial topologies might be
effective at integrating the workflows of small teams dedicated to the
development of a particular software product, but they are far less so when
applied to a firms’ total software output. Techniques such as normalized
production processes make it easier to catch bugs for large firms, but an
over-eager application of these techniques runs the risk of homogenizing
otherwise highly adapted teams. Secondly, there is the challenge of
inconsistency. Because, as we’ve explained above, DevOps techniques generally
arise within small, forward-looking teams, they are generally also highly
adapted to the particular needs of these same teams. This can mean that
managers trying to standardize DevOps across an organization can be faced with
dozens 9if not hundreds) of different approaches, many of which have proven to
be very effective. Finally, there is a more basic problem – that of
communication. Where DevOps works best, it facilitates close and continuous
communication between operations and development staff. Achieving this level
of communication not only involves that communications technologies and
platforms are in place; it also demands that teams be small enough that they
can genuinely talk to each other.
Majority of APAC firms pay up in ransomware attacks

The complexity of having to operate cloud architectures also had a significant
impact on the organisation's ability to recover following a ransomware attack,
according to Veritas. Some 44% of businesses with fewer than five cloud
providers in their infrastructure needing fewer than five days to recover,
compared to 12% with more than 20 providers doing likewise. And while 49%
of businesses with fewer than five cloud providers could restore 90% or more
of their data, only 39% of their peers running more than 20 cloud services
were able to do likewise. In Singapore, 49% said their security had kept pace
with their IT complexity. Their counterparts in India, at 55% were most
confident amongst other in the region about their security measures keeping
pace with their IT complexity. Just 31% in China said likewise, along with 36%
in Japan, 39% in South Korea, and 43% in Australia. With ransomware
attacks expected to continue to increase amidst accelerated digital
transformation efforts and the normalisation of remote work, enterprises in
the region will need to ensure they can detect and recover from such
attacks. Andy Ng, Veritas' Asia-Pacific vice president and managing
director, underscored the security vendor's recommended three-step layered
approach to detect, protect, and recover.
How to speed up malware analysis

The main part of the dynamic analysis is to use a sandbox. It is a tool for
executing suspicious programs from untrusted sources in a safe environment for
the host machine. There are different approaches to the analysis in sandboxes.
They can be automated or interactive. Online automated sandboxes allow you to
upload a sample and get a report about its behavior. This is a good solution
especially compared to assembling and configuring a separate machine for these
needs. Unfortunately, modern malicious programs can understand whether they
are run on a virtual machine or a real computer. They require users to be
active during execution. And you need to deploy your own virtual environment,
install operation systems, and set software needed for dynamic analysis to
intercept traffic, monitor file changes, etc. Moreover, changing settings to
every file takes a lot of time and anyway, you can’t affect it directly. We
should keep in mind that analysis doesn’t always follow the line and things
may not work out as planned for this very sample. Finally, it’s lacking the
speed we need, as we have to wait up to half an hour for the whole cycle of
analysis to finish. All of these cons may cause damage to the security if an
unusual sample remains undetected. Thankfully, now we have interactive
sandboxes.
Graph Databases Gaining Enterprise-Ready Features

Enterprise graph database vendor TigerGraph recently unveiled the results of
performance benchmark tests conducted on representative enterprise uses of its
scalable application. Touted by the company as a comprehensive graph data
management benchmark study, the tests used almost 5TB of raw data on a cluster
of machines to show the performance of TigerGraph. The study used the Linked
Data Benchmark Council Social Network Benchmark (LDBC SNB), which is a
reference standard for evaluating graph technology performance with intensive
analytical and transactional workloads. The results and performance numbers
showed that graph databases can scale with real data, in real time, according
to the vendor. TigerGraph claims it is the first industry vendor to report
LDBC benchmark results at this scale. The data showed that TigerGraph can run
deep-link OLAP queries on a graph of almost nine billion vertices (entities)
and more than 60 billion edges (relationships), returning results in under a
minute, according to the announcement. TigerGraph’s performance was measured
with the LDBC SNB Benchmark scale-factor 10K dataset on a distributed cluster
for the analysis. The implementation used TigerGraph’s GSQL query language,
which were compiled and loaded into the database as stored procedures.
Solving the performance challenges of web-scale IT

Two other components to be considered when it comes to performance monitoring
for web-scale IT are an in-memory database, and a strong testing
protocol. Kieran Maloney, IT services director at Charles Taylor,
explained: “Utilising an in-memory database and caching are ways to improve
the performance of web-scale applications, particularly for things like
real-time or near-time analytics. “The majority of cloud infrastructure
service providers now offer PaaS services that include in-memory capabilities,
which increase the speed at which data can be searched, accessed, aggregated
and analysed – examples include Azure SQL, Amazon ElastiCache for Redis,
Google Memorystore, and Oracle Cloud DB. “The other consideration for solving
performance management is a testing approach for identifying how the actual
performance is, and also determine whether there are specific aspects of the
application that are not performing, or could be “tuned” to improve
performance or the cost of operation. “There are a number of Application
Performance Testing tools available that provide business and IT teams with
real-time usage, performance and capacity analysis – allowing them to
proactively respond and make interventions to improve performance, as
required.”
Optimising IT spend in a turbulent economic climate

Having complete transparency and visibility of an organisations entire IT
ecosystem is an essential first step to optimising costs. This includes having a
full, holistic view across all solutions, whether they are on-premises or in the
cloud. The reality, however, is that many businesses have a fragmented view over
the technology applications within their organisation, which makes identifying
inefficiencies extremely difficult. Even before the shift to remote work, the
evolution of department-led technology purchasing had caused many IT teams to
lose visibility of their technology estate, including accounting for what’s
being used, how much and what tools are left inactive but still paid for. ...
Once a clear view of all technology assets has been defined, IT teams can then
start to assess the current usage and spend of the organisation. With many
employees working from home, it is likely they will be using a variety of new
tools to work effectively. Whilst it can be difficult to determine exactly what
is being used and by who when many workers are remote, having this information
is crucial to effectively reducing redundancies.
Quote for the day:
"Uncertainty is not an indication of poor leadership; it underscores the need for leadership." -- Andy Stanley
No comments:
Post a Comment